1 Technical & Quality Director, Commodities Global Service Lines, Bureau Veritas, Rotterdam, the Netherlands. commodities.bureauveritas.com
↩
2 Independent researcher, consultant, owner, KHE Consulting, Copenhagen, Denmark. kheconsult.com. Adjunct
professor, Aalborg University (AAU), Denmark; Adjunct professor, Geological Survey of Denmark and Greenland
(GEUS); Professeur associé, Université du Québec à Chicoutimi (UQAC), Québec; Guest professor University of South-
Eastern Norway (USN); Guest professor Recinto Universitario de Mayaguez, Puerto Rico
↩
his cannot be true—surely sampling and weighing are different activities. Well yes—and no! Sampling and weighing of traded metal, mineral and agro commodities are different activities—but at one or several stages in the supply chain they will come together in a single focus point, which is value ($, EUR). The commercial value of bulk commodities depends on two factors, quality and quantity. As an example, a shipment of iron ore with a certain certified weight cannot be traded without a reliable declaration of its quality, iron percentage. Similarly, a shipment of rice (assuming pure rice with no contaminants) cannot be paid for without its certified weight. At least once in all supply chains, someone in treasury will look at the final output of what has to be assumed is the result of diligent representative sampling and reliable weighing. But the final accounting will not show the overall accuracy and precision of sampling, preparation and analysis, and neither show the accuracy class of the weighing device. In the final accounting, this will all be the same for the user: what is important is the monetary value that is to be paid or received. The demands for minimisation of both sampling and mass determination errors are often hidden, but absolutely critical. This column specifically focuses on weighing errors in more detail, adding essential theoretical elements and practical know-how to the framework of the Theory of Sampling.
Quality and quantity – equal factors
In the world of commercial sampling of commodities this is nothing new. Historically, this was one of the driving forces why Pierre Gy started to address the fundamental conceptual and theoretical issues and the critical practical problems in sampling. Gy started to investigate the quality issue in earnest in his first assignment in 1946 in the then Belgian Congo, when he started out working as a research engineer for the mining and processing trade organisation Minerais et Metaux. 1–3
Gy realised that sampling of bulk particulate materials is a challenging combination of understanding the concept of heterogeneity and mastering the appropriate engineering principles involved, which many at the outset would believe could be significantly helped by statistics. After all, the term sampling is for very many (individuals, organisations, academic disciplines etc.) a statistical term. However, it turned out that statistics, based on analytical results, by itself would not deliver the solution to how to optimise sampling procedures and equipment when facing heterogeneous materials. Gy’s monumental theoretical analysis, developed over the next 25 years revealed the need for a set of sampling errors which are not all of the traditional statistical type, systematic vs random errors. In particular, Gy’s analysis uncovered bias-generating errors caused by the interaction of material heterogeneity and ill-reflected sampling procedures that had to be dealt with in a more comprehensive manner. 4,5 But statistics does play a role in the Theory of Sampling (TOS), which manifests itself in the fact that numerical determination of the quality factor is an estimation, an estimation of the composition of a lot. 6
But what about determination of the quantity of a lot, i.e. the weight of a lot? This is the subject matter covered in this column.
Representativity – at the centre of everything
A critical issue is: what are the criteria that need to be satisfied for a compositional estimation to be declared “representative”? Is it enough that certain error tolerances of the quality and quantity of an analytical aliquot are suitable for the needs of the person that will use it; for contractual purposes, for example? There is a practical side to this issue as well, one that has prompted introduction of the term “fit-for-purpose representativity”.
With the TOS as a guiding framework, 6–8 it turns out that these issues are rather intertwined, but fully resolvable. Assuming that the specific analytical method used can be relied upon to be “in statistical control”, i.e. the analytical process is accurate and precise according to universally agreed upon characteristics, a condition well complied with by all the world’s scientific, technical and commercial analytical laboratories. Then, in order for the analytical determination to be representative, it is necessary-and-sufficient that both the analytical aliquot, as well as the previous multi-stage samples and sub-samples, are all representative of the primary lot material. 4,5
This understanding is one of the TOS’ greatest achievements, that the entire “from-lot-to-aliquot” pathway is causally connected to the analytical determination and whether analytical results can correctly be considered representative, or not. In fact, the TOS stipulates that there is no characteristic of a sample itself that can vouch for its status – only the status of the entire sampling pathway is able to pass judgement on whether the test portion is representative or not. Thus, in a very direct sense, analytical results depend on the full “lot-to-aliquot” pathway – which can be representative but certainly also not, ibid. It matters very much that managers of analytical laboratories and Testing, Inspection, Certification (TIC) companies are aware of this critical connection; this context is described in depth in References 9 and 10.
However, at this point we may have already lost the interest and attention of the treasury department. Treasury: “Estimation? … Error tolerances? … Representativity? So what? The monetary value on the invoice is all that matters and the commodity will not change because of all that.” How correct – and how wrong at the same time!
Money rules the world – it is often claimed
he commodity does indeed not change in and of itself (loss, theft or damage excluded), but what if the analytical sample was not representative of the original lot, which it is always tacitly assumed to represent without ambiguity? This is the raison d’etre for the TOS.
If so, the invoice value will actually vary and be different if the commodity is sampled and tested at two or more TIC locations, e.g. loading port vs discharge port, or similar scenarios: lab 1 vs lab 2; buyer vs seller. Why? Because lot materials are always heterogeneous, a sampling bias will always ensue if all sampling operations involved in TIC are not representative. Thus, based on the TOS’ 70+ years’ experience, without guarantee for representativity, analysis of heterogeneous lots at two locations will assuredly always lead to dissimilar analytical results… and this ambiguity will only proliferate were additional attempts tried with the purpose of checking whether the sampling bias is constant. However, according to the TOS this can never be. 5,6
This is the point where we are absolutely sure to lose the treasury department:
Treasury: “The same lot, character ised at two ports, will always give rise to dissimilar analytical results? Always?” The treasury department, and/or the trader (commodity trader), will now likely hedge: “OK then, yes sure, this may be so, but we have the appropriate technical staff to take care of all this sampling”. However, what about weighing – in what sense can this be “the same as sampling”?
Sampling vs weighing
Well, weighing is also an act of estimation when weighing is carried out on an industrial scale as, for example, with traded bulk commodities. The question for weighing is, as with sampling: how representative shall it be? How accurate shall the mass determination have to be? Ultimately, within the weighing domain there are in fact both incorrect and correct weighing errors, in perfect analogy to the domain of sampling! To be demonstrated below.
Sampling errors: a breakthrough concept
Pierre Gy was able to come to grips with the reasons for non-representative sampling; there are several reasons. 4,7 He identified and analysed in detail the consequences of both unmitigated Incorrect Sampling Errors (ISE) and Correct Sampling Errors (CSE). The ISEs are:
Incorrect Delimitation Error (IDE)
Incorrect Extraction Error (IEE)
Incorrect Preparation Error (IPE)
Incorrect Weighting Error (IWE)
ISEs are responsible for creating a sampling bias, which must be avoided at all costs. 11 Below, we exemplify all these types of ISE in the weighing domain.
Weighing Incorrect Delineation Error (wIDE)
In sampling, avoiding IDE is all about strict reproducibility in delineating incremental cuts in a correct fashion, e.g. being able to take a full core from top to bottom in a stockpile (all the way to the bottom), or taking a complete planeparallel cross-section across the full material stream on a moving, or stopped, conveyor belt.
In weighing there are similarities when it comes to correctly delineating the mass that is weighed. An example from the weighing domain would be a weighing device that gradually moves away from its calibration condition: measurement “drift”. This is often the largest attributor to a weighing bias. If not properly trained, the operator of the weighing device is often not aware of this, but strongly believes that it is sufficient just to observe the service interval between calibrations prescribed in the manual accompanying the acquisition of the device. With industrial weighing devices, such as belt-scale weighers, there are many variables that each will have an impact on the device drifting further and further away from its last state of validation.
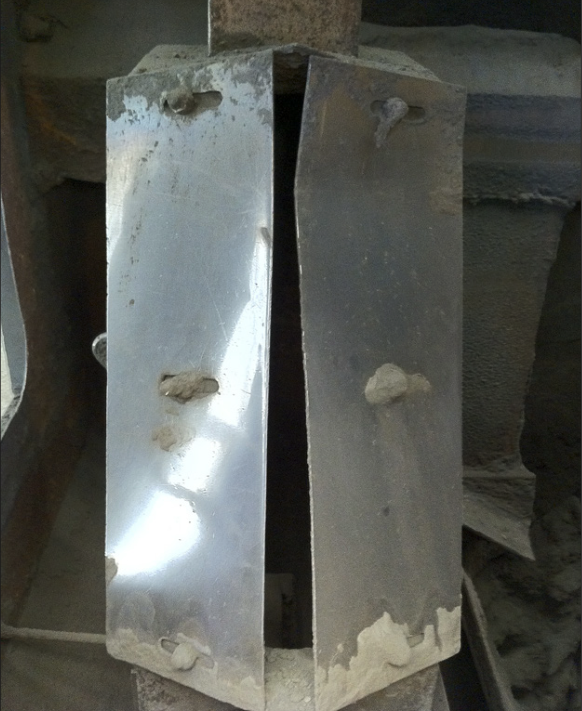
Figure 1. Falling stream cutter with contorted edges that result in incorrect delineation (IDE).
The analogy in the sampling domain is like not being able to observe the development of the crooked and contorted edges of a cross-stream sample cutter, Figure 1. In both cases a non-constant IDE is gradually developing, but this non-constant bias is hidden from view.
The following is a list of salient IDEs associated with a belt-scale weigher (Figure 2):
Change in belt length: because the physical belt material stretches over time
Change in belt tension: because of neglected checks and service of tensioners
Change in drum diameters: because of poor cleaning causing dirt between drum and belt
Mis-aligned weighing idlers: because of slacking of the belt
Slipping and/or dirt coverings of the speed sensor
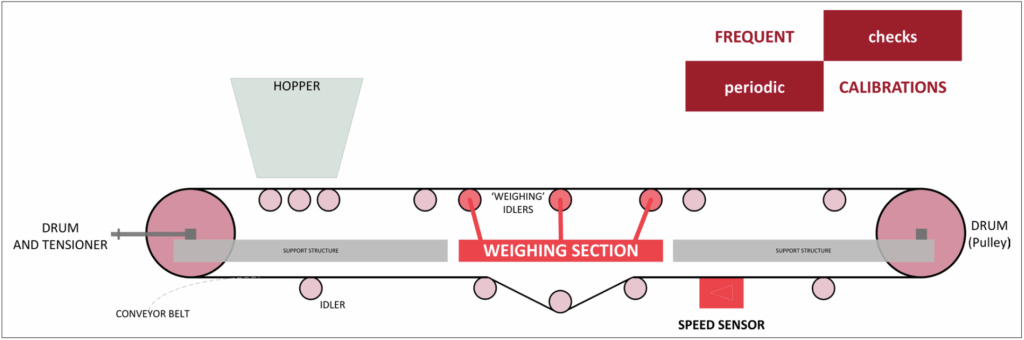
Figure 2. Principal set-up and key parts of a belt-scale weighing device.
Weighing IDEs must be eliminated to avoid bias, exactly as in the sampling domain. This is fully possible through frequent, or continuous, inspection and diligent maintenance of the mechanical weighing system, which would be proper diligence, more conscientious than just referring to the calibration validity sticker – if there is such a thing in the first place! It is all about inspection and maintenance here, about frequent checks and verifications. Above all, it is about proper training of the personnel involved – and not only about weighing, the full TOS framework needs to be in mind.
Weighing Incorrect Extraction Error (wIEE)
In the sampling domain, one is committing an IEE if not all of the (correctly) delimited cut is actually extracted. In the weighing domain this means that not all material is weighed even though it has been correctly delimited.
It is instructive to perform a “thought experiment” for weighing trucks over a weighbridge (Figure 3). Of course, interest is not in the mass of the trucks themselves, but specifically only in the mass of the cargos. For correct “extraction” of the mass, i.e. the correct determination of the weight, the requirement is, therefore, to weigh the truck twice: full and empty. The delimited difference between those two weighing results constitutes the cargo mass.
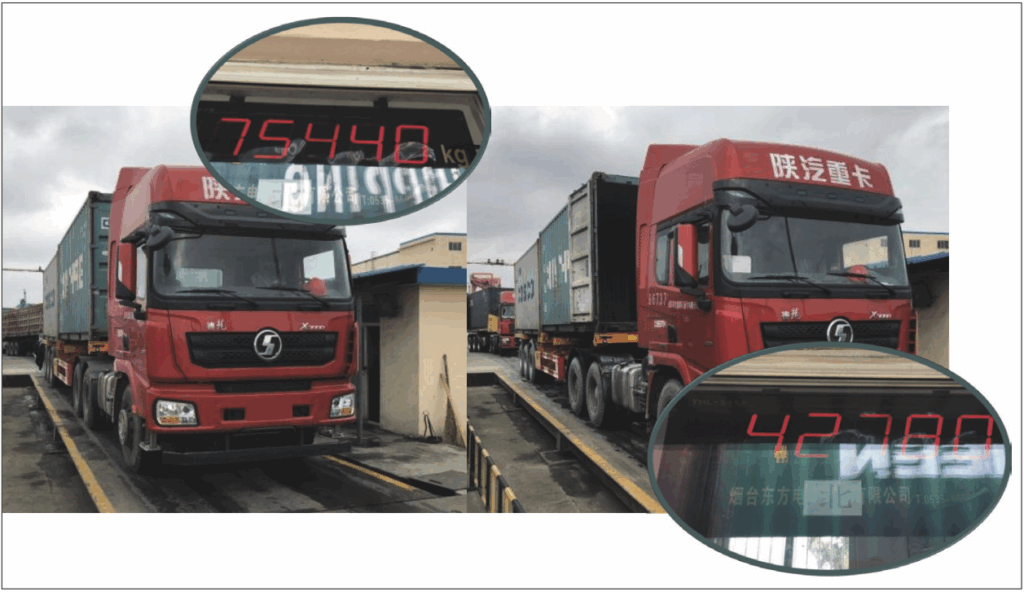
Figure 3. Full (container doors closed) container on truck: gross mass. After discharge, the empty container (doors open), the truck is weighed again: tare mass. The difference will be the cargo mass.
The weighing IEE, wIEE, crops up as a consequence of an attempted logistical shortcut during practical cycling of loading or discharge operations in a port, where the same trucks are used to transport a commodity over a relatively short distance. The wIEE originates here with the unfounded assumption that the mass of a specific empty truck is constant within a bracketed time frame and a within a well-defined specific port footprint. But it is not unheard of that the “burden” of weighing is reduced by only passing laden trucks over the scale and using the empty truck mass for more than one “trip” from storage to weighbridge to quayside and vice versa…or rather not vice versa, but proceeding straightaway to loading again. This means weighing any “unextracted” cargo remnant mass twice over, for example all of the two tons as seen in Figure 4 (right panel). The value of two tons of this specific material corresponds to EUR 2500; a shipment may consist of ~400 truckloads. One may imagine this to happen, say for every every fifth truck – with the result of EUR 200,000 worth of weighing error. The point here is also that this type of wIEE may not necessarily occur with any regularity with obvious consequences.
Figure 4. Left: Trucks moving in a port area from storage, via a weighbridge to quayside for discharge (v.v.). Right: Truck tipping cargo at quay for loading onto a receiving vessel. Inside the yellow circle 2000 kg of cargo remnants are visible that will remain inside the truck during its next trip (wIEE).
So far, the above “two out of two” signifies that certain ISE have direct counterparts in the weighing domain (IDE, wIDE; IEE, wIEE).
What about IPE (or IWE)?
The IPE, however, is an issue where there is no easy comparison, simply because there is not much to “prepare” in the weighing domain – and drawing a parallel with electric current fluctuations and its impact on the load cell signal and its calibrated value in kilograms may be more than a bit farfetched.
But there are occasions in which a critical but sometimes unrecognised IPE in the sampling domain, evaporation of moisture (loss of moisture), may have an analogue in the weighing domain. In both domains this takes the form of unrecognised, uncontrolled or unmitigated loss of moisture which is actually determined as weight differences. The classic example is a primary wet sample having to comply with a logistical waiting period in a dry environment before being transported to the central laboratory – but left in a container without a waterproof lid in high ambient temperatures. This scenario depicts unrecognised moisture loss that will interfere with subsequent moisture determination, which structurally will always be too low by an unknown proportion. This clearly leads to an inconstant, significant sampling bias (N.B. there are also other “agents” at work in the IPE domain; the above is not a comprehensive treatment.)
Moisture is a key parameter in most commodity trade TIC protocols, where similar mishaps may occur if sufficient professional competence is lacking. Perhaps the easiest way to cover all such possibilities is to focus on the time intervals in question, i.e. the time duration in which wet samples may unwittingly lose moisture, partially or completely. A disconnect between time and place of sampling and time and place of weighing is clearly a sampling error. There is a close connection to the topic “error” vs “uncertainty” presented and discussed in the preceding column, 12 in which can also be found an example of a strict parallel w.r.t. a mismatch error (disconnect) between the acquisition locations of spectra and reference samples [X,y] in a multivariate calibration data analytical context.
As a graphic example: what is the meaning of weighing a commodity of gold concentrates, packed in big bags, at the time when the consignment is loaded into the cargo holds of a container ship … when this is in fact ten days (10) after the “freshly filter-pressed concentrate” was sampled (following all the necessary principles in the TOS) during filling of the bags at the refinery plant. Unavoidably, some moisture will have seeped out of the bags in the 10-day interval prior to weighing, but how much? And was the moisture loss of similar magnitude for all bags? The mass of this moisture obviously should have been weighed at the same time as – and thus complementing—the compositional sampling! Somebody, or some protocol, is manifestly responsible – hence we are dealing with a sampling error, in this case a logistical error, an error that could and should have been avoided. Whether this scenario should be considered as a “classic” IPE or as a weighing IEE (wIEE) does not really matter. Either way, it is of critical importance to be in command of enough TOS and practical weighing competence to understand the manifest need to eliminate such an error, as no type of subsequent correction is ever possible.
ISE: Weighting
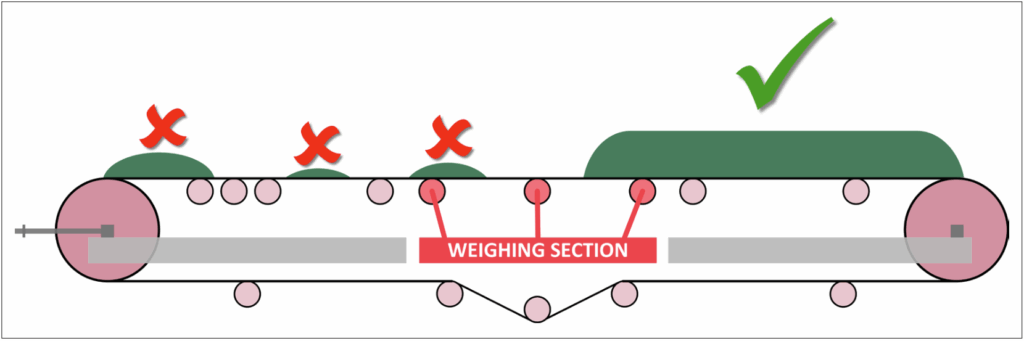
This topic may appear a little complex: please pay close attention to the letter “t” as what follows is about a technical weigh-t-ing error in weighing. Again, use is made of a belt-scale weigher as an example, not because they are flawed by design, but because they are very often used incorrectly – and they make for a particularly clear demonstration.
Figure 5 shows what is happening when mass is supposed to be determined by weighing, but without considerations of potential pitfalls. For an accurate mass determination to be possible, there must be a certain minimum load on the belt-scale weigher. If not, the tension of the (mostly) empty belt will prevent the downward force exerted by the “spotty” material stream on the belt to be registered by the load cell(s) in the weighing section. It is, therefore, important that the on-belt loading rate during cargo handling operations is properly controlled at all times, also during start-up and close to termination. On-belt loading rates should be constant as much as practicalities allow, so as to result in a steady state on-belt material steam (constant material flux). Operators of front-end-loaders that pile cargo onto the belt, crane operators that grab cargo from the holds of a vessel should be properly trained and well aware of this pertinent minimum load requirements of the weighing device. For professional work, it is unacceptable to let cargo “trickle” onto the belt for long(er) periods of time as the mass(es) involved will be underrepresented. Its proper mass(es) will go unnoticed. This is clearly a technical weigh-t-ing error – which unavoidably creates a weighing bias to be avoided “at all costs”. Somebody will clearly have to pay for the un-weighed mass(es), but whether this is the buyer or the seller is equally unacceptable from a professional TIC point of view. The responsibility of the TIC certification mandate is to eliminate this kind of unnecessary wISE.
Figure 5. Left (with error marks): Incorrect loading of the belt resulting in too low weight signal. Right (with correct check-mark): Correct, uninterrupted loading of the belt resulting in weight signal as designed.
Correct Weighing Errors …
Treasury: Sorry, what? “Correct … Errors, how can an error be correct?”. The reader is referred to Gy’s original definitions of correct vs incorrect errors. 5,10 In the sampling domain, CSEs can never be completely avoided as they are a function of the interaction between the quality variation of a heterogeneous lot and the sampling process with which increments are selected and extracted in practice. Any estimated sample composition, and hence also of the estimated lot composition, will inevitably show a difference with respect to the true lot value. 1–6,11 The magnitude of this CSE (most often it is the sum of the Fundamental Sampling Error and a residual Grouping and Segmentation Error) needs to be managed by first setting an acceptable CSE target threshold and then designing a sampling plan in which the number of primary increments (Q) is the key parameter with which to make the total CSE in compliance – for significantly heterogeneous materials, more TOS facilities may also have to be used. This is where the full TOS framework must be at the disposition of the operator, supervisor, CTO …
But in most weighing scenarios of bulk commodities, the whole cargo must be weighed. The situation here often is that what the properly managed, meticulously calibrated and well-maintained weighing instrument shows… is the true weight. But this is based on a wrong assumption, as will be explained.
ISO standards, such as ISO 12743, provide examples of overall targets for desired CSE magnitudes. Remember that at this stage it is traditionally assumed that all bias-generating errors (ISE) have indeed been eliminated (a very convenient assumption). But, assumptions are not always right….
Food for thought: A target value for standard deviation of nickel determination may be, say, 0.2 % (absolute). With precision at 95 % confidence, roughly twice standard deviation gives us a target of 0.4 %, IF all incorrect errors have indeed been removed, all that remains is precision only. Weighing Standards such as issued by OIML and NIST are manifestly based on this fundamental assumption that there is no bias. Confusingly, however, these weighing reference standards still speak of “accuracy class” and not “precision class”. “Accuracy classes” are decided upon according to the number and the value of scale divisions of the pertinent weighing devices. This means that the accuracy of a scale is dependent on a value expressed in a unit of measurement (e.g. kilogram) between two consecutive division indications. Let’s again take the weighbridge as an example: most weigh bridges are of OIML or NIST accuracy Class III, which means they have between 500 and 10,000 scale divisions. So, for a Class III weighbridge of 50,000 kg capacity and 500 scale divisions, the smallest unit indication is 100 kg. For another Class III weighbridge of 50,000 kg capacity but 10,000 scale divisions, the similar unit indication is 5 kg. It is very clearly not accuracy that is discussed here, but precision – QED.
Augmented TOS insight: The number of scale divisions in the weighing domain is what the number of primary increments is in the sampling domain! The higher the number of scale divisions, the more precise the weighing will be. It will perhaps not come as a surprise that the price of a weighing instrument shows a clear correlation with the number of scale divisions it provides. This situation prompts some wondering at the all important treasury department…
“Wow”, so the inexpensive, yet contractually binding Class III weighbridge at our receiver port in Houston, TX, can have a 20 times greater error than my own expensive weighbridge in Rotterdam with its “superior” 10,000 scale divisions?” Well yes, but this is not all… The precision target for Class III weighing devices may be about more than just scale division. The Maximum Permissible Error (MPE) for Class III weighing devices according to OIML can be three (3) scale divisions; while for NIST Class III it can be up to five (5)! For readers not in full TOS command, apologies for a slight possible confusion here, as MPE is also known as the acronym for Minimum Possible Error. However, from the specific context there is never any serious misunderstanding possible; the latter MPE applies to variographic analysis, while the former MPE pertains to weighing exclusively; if necessary the terms MPEvariographics vs MPEweighing can be used.
Treasury: “What? So my container that was weighed as 39,500 kg may have had a MPE of 60 kg here in the Netherlands, but our recent dispute, where the container was weighed for payment in the USA as 39,000 kg, could just have been a result of the MPE of 500 kg ‘over there’?”
Well yes, but wait, there is still more! Remember that for proper determination of cargo mass, one actually needs to weigh the container twice: as full and as (assured) empty. Consequently, one will then need to consider MPE twice…. Keep your weighing balance sheet flexible!
All this potential confusion (if you are not a very experienced, indeed a chartered operator) is all for scales that has the same accuracy class on their treasured calibration certificate, but which in reality are not identical in practice. And the present initiation to the weighing domain has not even looked at different types of weighing instruments and different accuracy classes yet!
Minnitt hit the nail on its head when he stated: 13 “The costs of sampling installations and new equipment are usually hard for management to accept because the adverse effects of poor sampling practice never appear on the balance sheet. The mining industry is replete with stories about the adverse effects of trying to save money on sampling equipment and installations.”
To which the present authors would like to add: “Sampling and weighing are the same type of criticality for more fully transparent balance sheet and final report information”.
MPEweighing is a Correct Weighing Error and should be given the same attention as a Correct Sampling Error!
Weighing along the mine-to-loading port-to-cargo-to-discharge port-to-balance sheet
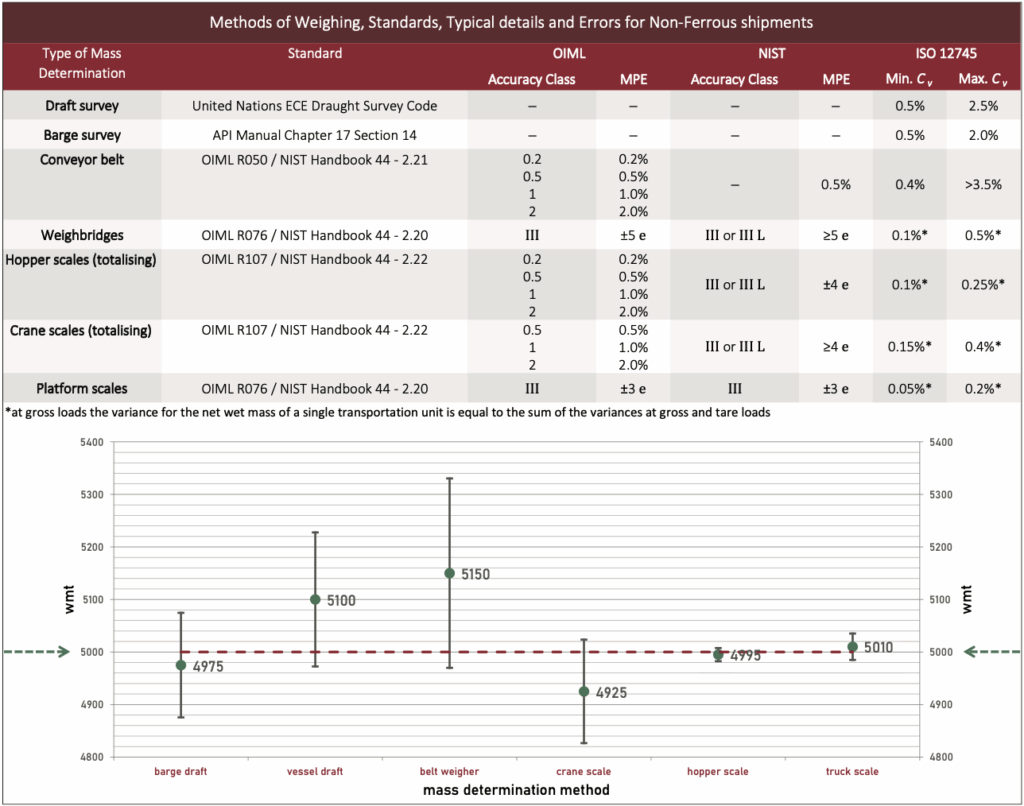
Here is a way to try to express the cost of weighing imprecision as a result of different devices available at the principal locations along the commercial TIC pathway. It is a thought experiment of weighing a commodity along the full supply chain from mine to terminals and ports to its destination. For this demonstration we make use of a commodity parcel which is prescribed a precise weight of 5000 tons – it is not the weight per se that is of interest, it is the deviations from this nominal weight it experiences on its merry way. This parcel is, furthermore, completely oblivious to changes in moisture a.o.—not a gram of moisture was lost n transit, and not a kilo was picked up as dirt (no IPE). But the commodity was weighed with the different devices and methods in use at the principal locations shown in Figure 6, each with their own precision characteristics. The magnitude of imprecision is expressed by the length of the whiskers extending from each estimated mass (±2 std).
Each weighing method estimated the mass of the commodity according to appropriate manuals and standards, and importantly, MPE was not exceeded anywhere. Yet the maximum difference between six weighing methods, all used appropriately and in full compliance, was no less than 225 metric tons. This is an example slightly on the extreme side, but fully realistic. In this context, using the same commodity as in the wIEE example above (EUR 1250/ton), some trading entity would have unnecessarily lost or gained the equivalent of EUR 280,000 depending on which weight estimate was used. Far from trivial in commodity trading… and great for the present didactic demonstration. The lesson is clear: there is sampling expertise (use it well), and there is weighing experience (use it well) – and your TIC partner better be fully competent in both aspects. Sampling and weighing are two sides of the same TIC coin.
Figure 6. Top: Table with methods of weighing and interpretation of precision (MPE and Coefficient of variation). Bottom graph: Visual representation of mass estimations and precision “whiskers” of different weighing methods on the same nominal 5000 tons cargo.
Sampling and weighing – different but the same…
Based on Reference 14: “From the early conceptual stages of designing logistics of a port or terminal where sampling and weighing is needed, all the way to manual sampling for lack of other options, expert advice should always be taken to ensure that:
Proper unrestricted ‘access’ is available for correct sampling equipment [the TOS’ Fundamental Sampling Principle must be complied with, at all times and at all locations].
Sample mass and frequency are ‘selected’ in accordance with the specific heterogeneity characteristics of the material vs the desired risk for being wrong.
Sampling increments, or cuts, are taken by a properly designed and maintained plan that assuredly will ‘include’ all particles of the lot without changing the commercial characteristics in any of the subsequent processes leading to the final portion that is tested.” The parallel with weighing:
There is a proper location and an appropriate instrument for correct weighing.
Accuracy class and scale divisions are “selected” in accordance with the specific material properties – price! – vs the desired risk for being wrong.
Weighing follows a properly designed and maintained plan that will ensure that all particles of the lot will be weighed; nothing is added, nothing is lost.
Conclusions
This column only offers an initiation to the domain of weighing as a critical complement to the sampling domain; this column presents critical elements for an augmented TOS framework.
It would appear that in the weigh- ing domain most attention is given to the technology involved, i.e. to weighing devices and their installation, and to calibrating and verification (most likely carried out during commissioning), while often neglecting their true design objectives and especially the actual performance during long(er) lifetimes in action where “better-safe-than-sorry” checks and inspection are of critical importance. Compare with the sampling domain, where focus all too often is overly on analysis s.s. and very often focused on Measurement Uncertainty (MUanalysis), to the neglect of the full complement of possible sampling and subsampling errors that manifestly all reside in the before analysis domain.
Typical weighing domain errors (wIDE, wIEE, MPEweighing) were introduced and illustrated with the intent to augment the TOS’ framework. The TOS is the only guarantee for sampling representativity due to bias that could have been avoided and precision that could have been achieved. The analogue scenario in the weighing domain concerns an unnecessary loss of trust w.r.t. certified weight declarations.
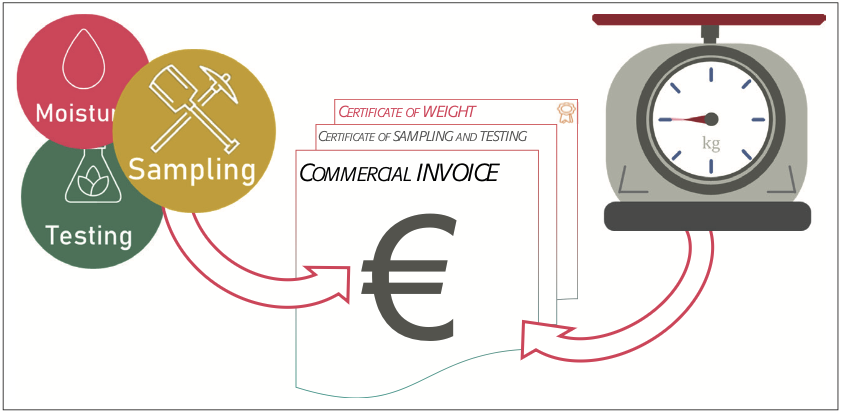
Since (in the context of the present discussion) “value” = representative “composition” × unbiased “mass”, sampling and weighing are both different, and the same… Thus, the final outcome of sampling and weighing marry each other and merge into the same commercial unit of measurement: value, Figure 7 .
Figure 7. Sampling and weighing ultimately merge into one value: the one on the invoice.
References
[] P. Gy, “Par t IV: 50 years of sampling theory – a personal history”, Chemometr. Intell. Lab. Syst. 74, 49–60 (2004) . https://doi.org/10.1016/j.chemolab.2004.05.014
[] R.C.A. Minnitt and K.H. Esbensen, “Pierre Gy’s development of the Theory of Sampling: a retrospective summary with a didactic tutorial on quantitative sampling of one-dimensional lots”, TOS Forum Issue 7, 7–19 (2017). https://doi.org/10.1255/tosf.96
[] R.C.A . Minnit t, “The Pierre Gy Oration”, TOS Forum Issue 8, 17 (2018). https://doi.org/10.1255/tosf.104
[] K.H. Esbensen, “Pierre Gy (1924–2015): the key concept of sampling errors”, Spectrosc. Europe 30(4), 25 – 28 (2 018 ).https://doi.org/10.1255/sew.2018.a1
[] P. Gy, Sampling for Analytical Purposes. Wiley, Chichester (1998).
[] K.H. Esbensen, Introduction to the Theory and Practice of Sampling. IMP Open, Chichester (2020). https://doi.org/10.1255/978-1-906715-29-8
[] K.H. Esbensen, “TOS reflections: is there a third way? (to promote the Theory of Sampling)”, TOS Forum Issue 10, 21 (2020). https://doi.org/10.1255/tosf.122
[] K.H. Esbensen, “Sampling commitment – and what it takes … ”, Spectrosc. Europe 31(1), 24–28 (2019). https://doi.org/10.1255/sew.2019.a2
[] K.H. Esbensen, “A tale of two laboratories I: the challenge”, Spectrosc. Europe 30(5) , 23–28 (2018). https://doi.org/10.1255/sew.2018.a3
[] K.H. Esbensen, “A tale of two laboratories II: resolution”, Spectrosc.Europe 30(6) , 26–28 (2018).https://doi.org/10.1255/sew.2018.a4
[] K.H. Esbensen and C. Wagner, “Why we need the Theory of Sampling”, The Analytical Scientist 21, 30–38 (2014).
[] R.J. Romañach, A. Joubert Castro and K.H. Esbensen, “WHAT are sampling errors—and WHAT can we do about them? Part 1”, Spectrosc. Europe 33(2), 36–42 (2021). https://doi.org/10.1255/sew.2021.a11
[] R.C.A. Minnitt, “Sampling: the impact on costs and decision making”, The Southern African Institute of Mining and Metallurgy 107, 460 (2007).
[] D.A. Vogel, “Access, Select, Include – a review of the commercial sampling of traded bulk commodities in the context of Gy’s Theory of Sampling”, in Proceedings of the 8th World Conference on Sampling and Blending, Perth, Australia. The Australasian Institute of Mining and Metallurgy, Melbourne, pp. 367–378 (2018).
An aliquot is the ultimate sub-sample extracted in a 'Lot-to-Aliquot' pathway for analysis. By analogy, process analytical technology involves the extraction of virtual samples, which are defined volumes of matter interacting with a process analytical instrument.
Analysis
Analysis is the systematic examination and evaluation of the ultimate sub-sample of chemical, biological, or physical substance (Aliquot) to determine its composition, structure, properties, or presence of specific components.
Analytical Bias
Analytical bias is a systematic deviation of measured values from true values. An analytical bias can arise from multiple sources, including instrument calibration errors, sample preparation techniques, operator method, or inherent methodological limitations. Unlike random errors, which fluctuate unpredictably, analytical bias consistently skews results in a particular direction. Identifying and correcting this bias is crucial to ensure the accuracy and reliability of analytical data (bias correction).
Analytical Precision
Analytical precision refers to the degree of agreement among repeated analyses of the same aliquot under identical conditions. It reflects the consistency and reproducibility of the results obtained by a given analytical method. High precision indicates minimal random analytical error and close clustering of analytical results around an average. Precision does not necessarily imply accuracy, as a method can be precise yet still yield systematically biased results.
C
Composite Sampling
Composite sampling extracts a number (Q) of Increments, established to capture the Lot Heterogeneity. Composite sampling is the only way to represent heterogeneous material. A composite sample is made by aggregating the Q increments subject to the Fundamental Sampling Principle (FSP). The required amount of increments for the requested RepresentativityQ can be carefully established to make sampling fit-for-purpose.
Compositional Heterogeneity (CH)
Compositional heterogeneity is the variation between individual fundamental units of a target material (particles, fragments, cells, ...). CH is an intrinsic characteristic of the target material to be sampled.
Correct Sampling Errors (CSE)
CSE are the errors that cannot be eliminated even when sampling correctly (unbiased) according to the Theory of Sampling (TOS). CSE are caused by Lot Heterogeneity and can only be minimised.
Crushing is the term used for the process of reducing particle size. Other terms are grinding, milling, maceration, comminution. Particle size reduction changes the Compositional Heterogeneity (CH) of a material. Composite Sampling and crushing are the only agents with which to reduce the Fundamental Sampling Error (FSE).
D
Data Format
Data must be reported as the measurement results and the Measurement Uncertainties stemming from sampling and analysis. Note that MUAnalysis and MUSampling are expressed as variances.
Data = Measurement +/- (MUSampling ; MUAnalysis)
Example: 375 ppm +/- (85 ppm ; 18 ppm)
Note that the Uncertainties 85 ppm and 18 ppm are the square roots of MUSampling and MUAnalysis.
Distributional heterogeneity is the variation between groups of fundamental units of a target material. Groups of units manifest themselves as Increments used in sampling. DH is an expression of the spatial heterogeneity of a material to be sampled (Lot).
DS3077:2024
This standard is a matrix-independent standard for representative sampling, published by the Danish Standards Foundation. This standard sets out a minimum competence basis for reliable planning, performance and assessment of existing or new sampling procedures with respect to representativity. This standard invalidates grab sampling and other incorrect sampling operations, by requiring conformance with a universal set of six Governing Principles and five Sampling Unit Operations. This standard is based on the Theory of Sampling (TOS).
A dynamic lot is a moving material stream where sampling is carried out at a fixed location. For both Stationary Lots and Dynamic Lots, sampling procedures must be able to represent the entire lot volume guided by the Fundamental Sampling Principle.
F
Fractionation
Fractionation is a way of processing a Lot or Sample before sampling (or subsampling). Fractionation separates materials/lots into fractions according to particle properties, e.g. size, density, shape, magnetic susceptibility, wettability, conductivity, intrinsic, or introduced moisture ...
Fundamental Sampling Error (FSE)
FSE results from the impossibility to fully compensate for inherent Compositional Heterogeneity (CH) when sampling. FSE is always present in all sampling operations but can be reduced by adherence to TOS' principles. Even a fully representative, non-biased sampling process will be unable to materialise two samples with identical composition due to Lot Heterogeneity. FSE can only be reduced by Crushing (followed by Mixing / Blending) i.e. by transforming into a different material system with smaller particle sizes.
Fundamental Sampling Principle (FSP)
The Fundamental Sampling Principle (FSP) stipulates that all potential LotIncrements must have the same probability of being extracted to be aggregated as a Composite Sample. Sampling processes in which certain areas, volumes, parts of a Lot are not physically accessible cannot ensure Representativity.
Process of extracting a singular portion of the Lot. Grab sampling cannot ensure Representativity for heterogeneous materials. Grab sampling results in a sample designated a Specimen.
Grouping and Segregation Error (GSE)
The GSE originates from the inherent tendency of Lot particles, or fragments hereof, to segregate and/or to group together locally to varying degrees within the full lot volume. This spatial irregularity is called the Distributional Heterogeneity (DH). There will always be segregation and grouping of Lot particles at different scales. GSE plays a significant role in addition to the Fundamental Sampling Error FSE. Unlike FSE however, the effects from GSE can be reduced in a given system state by Composite Sampling and/or Mixing / Blending. GSE can in practice be reduced significantly but is seldomly fully eliminated.
H
Heterogeneity
Heterogeneity refers to the state of being varied in composition. It is often contrasted with homogeneity, which implies complete similarity among components, which is a rare case. For materials in science, technology and industry heterogeneity is the norm. Heterogeneity applies to various contexts, such as populations of non-identical units, bulk materials, powders, slurries, biological swhere multiple distinct components coexist.
Heterogeneitytests are used for optimizing sampling protocols for a variable of interest (analyte, feature) with regards to minimising the Fundamental Sampling Error (FSE).
Experimental approaches available are the 50-particle method, the heterogeneity test (HT), the sampling tree experiment (STE) or the duplicate series/sample analysis (DSA), and the segregation free analysis (SFA).
Recently, sensor-based heterogeneity tests have been introduced which bring the advantage of cost-effective analysis of large numbers of single particles.
Homogeneity
An assemblage of material units with identical unit size, composition and characteristics. There are practically no homogenous materials in the realm of technology, industry and commerce (mineral resources, biology, pharmaceuticals, food, feed, environment, manufacturing and more) of interest for sampling. With respect to sampling, it is advantageous to consider that all materials are in practice heterogeneous.
I
Incorrect Delimitation Error (IDE)
The principle for extracting correctIncrements from processes is to delineate a full planar-parallel slice across the full width and depth of a stream of matter (Dynamic Lot. IDE results from delineating any other volume shape. When a sampling system or procedure is not correct relative to the appropriate Increment delineation, a Sampling Bias will result. The resulting error is defined as the Increment Delimitation Error (IDE). Similar IDE definitions apply to delineation and extraction of increments from Stationary Lots.
Incorrect Extraction Error (IEE)
Increments must not only be correctly delimitated but must also be extracted in full. The error incurred by not extracting all particles and fragments within the delimitated increment is the Increment Extraction Error (IEE). IDE and IEE are very often committed simultaneously because of inferior design, manufacturing, implementation or maintenance of sampling equipment and systems.
Incorrect Preparation Error (IPE)
Adverse sampling bias effects may occur for example during sample transport and storage (e.g. mix-up, damage, spillage), preparation (contamination and/or losses), intentional (fraud, sabotage) or unintentional human error (careless actions; deliberate or ill-informed non-adherence to protocols). All such non-compliances with the criteria for representative sampling and good laboratory practices (GLP) are grouped under the umbrella term IPE. The IPE is part of the bias-generating errors ISE that must always be avoided.
Incorrect Sampling Errors (ISE)
There are four ISE, which result from an inferior sampling process. These ISE can and must be eliminated.
IWE reflects specific weighing errors associated with collecting Increments. For process sampling, IWE is incurred when extracted increments are not proportional to the contemporary flow rate (dynamic 1-dimensional lots), at the time or place of extraction. IWE is often a relatively easily dealt with appropriate engineering attention. Increments, and Samples, should preferentially represent a consistent mass (or volume).
Increment
Fundamental unit of sampling, defined by a specific mass or correctly delineated volume extracted by a specified sampling tool.
L
Legal Person
A legal person is any person or entity that can do the things a human person is usually able to do in law – such as entering into contracts or commit to specified obligations.
Lot
a) A Lot is made up of a specific target material to be subjected to a specified sampling procedure.
b) A Lot is the totality of the volume for which inferences are going to be made based on the final analytical results (for decision-making). Lot size can range from being extremely large (e.g. an ore body, a ship) to very small (e.g. a blood sample).
c) The term Lot refers both to the material as well as to lot size (volume/mass) and physical characteristics. Lots are distinguished as stationary or dynamic lots. A stationary lot is a non-moving volume of material, a dynamic lot is a material stream (Lot Dimensionality). For both stationary and dynamic lots, sampling procedures must address the entire lot volume guided by the Fundamental Sampling Principle (FSP).
Lot Definition
Lot Definition describes the process of defining the target volume, which will be subjected to Sampling.
Lot Dimensionality
TOS distinguishes Lot volume according to the dimensions that must be covered by correct Increment extraction. This defines the concept of 'lot dimensionality', an attribute which is independent of the lot scale. Lot dimensionality is a characterisation to help understand and optimise sample extraction from any lot at any sampling stage. There are four main lot types: 0-, 1-, 2- and 3-dimensional lots (0-D, 1-D, 2-D and 3-D lots).
Lots are classified by subtracting the dimensions of the lot that are fully 'covered' be the salient sampling extraction tool in question. The higher the number of dimensions fully covered in the resulting sampling operation, the easier it is to reduce the Total Sampling Error TSE.
Lot Dimensionality Transformation (LDT)
By the Governing Principle Lot Dimensionality Transformation LDT, stationary 0-D, 2-D and 3-D lots can in many cases advantageously be transformed into dynamic 1-D lots, enabling optimal sampling. However, the application of LDT has practical limits as some lots cannot be transformed (e.g. a body of soil, or a mine resource, biological cells). The optimal approach for such cases is penetrating one dimension with complete increment extraction (usually height) turning a 3-D lot into a 2-D lot.
Mass-reduction is a physical process that divides a given quantity into manageable sub-samples. Mass-reduction must ensure that these sub-samples are representative of the original quantity (Representative Mass Reduction – Subsampling
Measurement
The total process of producing numerical data about a Lot, including sampling and analysis is called Measurement. Simultaneously, sensor-based analytical technology combines virtual sampling and signal processing. For both types of measurements the principles and rules of the Theory of Sampling apply.
Measurement Uncertainty (metrological term) (MU)
MU expresses the variability interval of values attributed to a quantity measured. MU is the effect of a particular error, e.g. a sampling error, or an analytical error or of combined effects (see MUTotal).
MUsampling reflects the variability stemming from sampling errors
MUanalysis reflects the variability stemming from analytical errors
MUtotal is the effective variability stemming from both sampling and analysis
MUtotal= MUsampling+ MUanalysis
Mixing / Blending
Mixing and blending reduces Distributional Heterogeneity (DH) before sampling/sub-sampling. N.B. Forceful mixing is a much less effective process than commonly assumed.
P
Particle-Size-Heterogeneity (PH)
PH is the compositional difference due to assemblages of units with different particle sizes (or particle-size classes).
Pierre Gy
The founder of the Theory of Sampling (TOS), Pierre Gy (1924--2015) single-handedly developed the TOS from 1950 to 1975 and spent the following 25 years applying it in key industrial sectors (mining, minerals, cement and metals processing). In the course of his career he wrote nine books and gave more than 250 international lectures on all subjects of sampling. In addition to developing TOS, he also carried out a significant amount of practical R&D. But he never worked at a university; he was an independent researcher and a consultant for nearly his entire career - a remarkable scientific life and achievement.
Precision
Precision is a measure of the variability of quantitative results. The larger the variability, the smaller the precision. In practice, precision is measured as the statistical variance s2 of the quantitative results (square of the standard deviation).
Primary Sample
The initial mass extracted from the lot. The Primary Sample is the product of Composite Sampling and consists of QIncrements. Both the mass of the Primary Sample as well as the number of increments extracted influence the sampling variability. As the primary sampling stage often has by far the largest impact on MUTotal, optimisation always starts at this stage.
Principle of Sampling Correctness (PSC)
The Principle of Sampling Correctness (PSC) states that all TOS' Incorrect Sampling Errors (ISE) shall be eliminated, or a detrimental Sampling Bias will have been introduced.
Principle of Sampling Simplicity (PSS)
PSS states that sampling along the Lot-to-Aliquot can be optimised separately for each (primary, secondary, tertiary ....) sampling stage. Since the Primary Sampling stage is often the dominant source of sampling error, optimization logically shall always begin at this stage.
Process Periodicity Error (PPE)
PPE is incurred if short-, mid- or long-term periodic process behaviour is not corrected for, in which case it may contribute to a sampling bias.
A process sampling strategy must make use of a high enough sampling frequency to uncover such behaviours; the sampling frequency must as a minimum always be higher than twice the most frequent periodicity encountered.
PTE occurs if mid- to long-term process trends are not corrected for, in which case they may contribute to a Sampling Bias. PTE and Process Periodicity Error PPE may, or may not, occur simultaneously depending on the specific nature of the process to be sampled.
The replication experiment RE consists of a series of independent complete ‘Lot-to-Aliquot’ analytical determinations, made under identical conditions. The number of replications is termed R. RE provides MUSampling + MUAnalysis.
Representative Mass Reduction – Subsampling
Representative Mass Reduction (RMR) aka sub-sampling. TOS argues why Riffle-Splitting and Vezin-sampling are the only options leading to Representative Mass Reduction.
Representativity
A sampling process is representative if it captures all intrinsic material features, e.g., composition, particle size distribution, physical properties (e.g. intrinsic moisture) of a Lot.Representativity is a characteristic of a sampling process in which the Total Sampling Error and Total Analytical Error have been reduced below a predefined threshold level, the acceptable Total Measurement Uncertainty. Representativity is the prime objective of all sampling processes. The representativity status of an individual sample cannot be ascertained in isolation, if removed from the context of its full sampling-and-analysis pathway. The characteristic Representative can only be accorded a sampling process that complies with all demands specified by TOS (DS3077:2024).
S
Sample
Extracted portion of a Lot that can be documented to be a result of a representative sampling procedure (non-representatively extracted portions of a Lot are termed Specimens).
Closeness of the analytical result of an Aliquot with regards to the true concentration of the Lot]/glossary]. NB. “sampling accuracy” = “sampling + analytical accuracy”
Sampling Bias
The Sampling Bias is the difference between the true Lot concentration and the average concentration from replicated sampling. Such a difference is a direct function of the Lot Heterogeneity and as such inconstant; it changes with each additional sampling and can therefore not be corrected for. This is the opposite to the Analytical Bias for which correction is often carried out.
Sampling Error Management (SEM)
SEM determines the priorities and tools for all sampling procedures in the following order:
The Sampling Manager is the Legal Person accountable for ensuring that all sampling activities are conducted in accordance with scientifically valid principles to achieve representative results. They are responsible for managing the design, implementation, and evaluation of sampling protocols while balancing constraints such as material variability, logistics, and resource limitations. This role requires expertise in the Theory of Sampling (TOS), leadership, project management and stakeholder communication skills.
Sampling Precision
The Sampling Precision is the variance of the series of analytical determinations, for example from a Replication Experiment (RE). Sampling precision always includes the Analytical Precision, since all analysis is always based on an analytical Aliquot, which is the result of a complete 'Lot-to-Aliquot' sampling pathway. Therefore sampling precision = sampling + analysis precision.
Sampling Protocol
Document explaining the undertakings necessary for the sampling process. It contains the tools and procedures from Lot-to-Aliquot[/glossary].
Sampling Scale Invariance (SCI)
The Principle of SSI states that all Sampling Unit Operations (SUO) can be applied identically to all sampling stages, only the scale of sampling tools differs.
Sampling Uncertainty
Sampling Uncertainty is the difficulty of collecting a representativesample due to Lot Heterogeneity; the more heterogeneous the material, the higher the uncertainty associated with any sample attempting to represent the whole Lot.
A specimen is a portion of a larger mass/volume (Lot) extracted by a non-representative sampling process. Grab Sampling results in a specimen.
Stakeholder
A Stakeholder is any entity interested in the result coming from sampling and analysis. Data representing stationary or flowing heterogeneous materials are requested by different parties with a multitude of differing objectives. Stakeholders can be internal, from commercial organisations, public authorities, research and academia or non-governmental organisations.
Stationary Lot
A Stationary Lot is a non-moving volume of material where sampling is carried at from multiple locations, each resulting in an Increment. For both Stationary Lots and Dynamic Lots, sampling procedures must address the entire Lot volume guided by the Fundamental Sampling Principle (FSP).
TAE is manifested as the Measurement Uncertainty resulting only from analysis (MUAnalysis). TAE includes all errors occurring during assaying and analysis (e.g. related to matrix effects, analytical instrument uncertainty, maintenance, calibration, other), as well as human error.
Total Measurement Uncertainty
Whereas Measurement Uncertainty (MU) is traditionally only addressing analytical determination, e.g. concentration := 375 ppm +/- 18 ppm (MUanalysis), Theory of Sampling (TOS) stipulates reporting analytical results with uncertainty estimates from both sampling and analysis. This gives users of analytical data the possibility to evaluate the relative magnitudes of MUsampling vs. MUanalysis, enabling fully informed assessment of the true, effective data quality involved. A complete data uncertainty must have this format:
MUTotal = MUSampling + MUAnalysis
The attribute Total Measurement Uncertainty (MUTotal) is the most important factor determining the attribute data quality.
Variography is a variability characterisation of a dynamic 1-dimensional dynamic lot. A variogram describes variability as a function of Increment pair spacing (in time). Variography is also applied in geostatisctics in describing the variability as a function of spacing/distance between analyses.