1 Adjunct professor, Aalborg University (AAU), Denmark; Adjunct professor, Geological Survey of Denmark and Greenland (GEUS); Professeur associé, Université du Québec à Chicoutimi (UQAC), Quebec; Guest professor University of Southeast Norway (USN); Guest professor (2018) Recinto Universitario de Mayaguez, Puerto Rico. khe.consult@gmail.com, www.kheconsult.com
↩
This column concludes the first series of Sampling Columns. More will appear in a sequel series, mainly aimed at presenting practical examples, case histories, demonstrations—all of which will assume that the value of only practicing representative sampling has been fully acknowledged and the relevant know how has been comprehended. Here, we end the first educational exposé of the Theory of Sampling (TOS) by focusing on the current state of awareness and with an acknowledgement of the need to involve TOS in all relevant international scientific fora, in technology, industry and in the commercial marketplace.
Historical context
The history of the World Conference of Sampling and Blending (WCSB),1 gives a snapshot of the highly satisfactory progress seen in the last 20 years since WCSB1 (2003), in which dissemination of the Theory of Sampling (TOS) has improved greatly. Reference 2 contains a plethora of earlier relevant historical references for the interested reader.
WCSB1 was the inaugural world conference on sampling, and the proceedings were conceived as a comprehensive tribute to the founder of TOS, Pierre Gy. The historical context leading up to WCSB1 can be found in Reference 3. Among Pierre Gy’s last publications is a fascinating account of the history of the development of TOS; in retrospect this is his scientific testament.4
Awareness
Despite this extensive activity, there are still innumerable occasions in science, technology, industry, and in governing, monitoring and regulation bodies in which awareness of the need for representative sampling is still more-or-less unknown. There are also on record cases in which this knowledge is deliberately not welcomed – we shall here a.o. focus on why such might be the case. Awareness and acknowledgement of the usefulness of applied TOS is an ongoing process that cannot be said to be likely to be completed anytime soon (count-ing in decades here). There is still much work to do.
So how to advance this critical awareness?
In areas, industrial sectors a.o., which have been “covered”, this mainly scales with the intensity of additional efforts put in, but it is equally important to direct efforts to new fora in which TOS and relevant applications have not yet been introduced. This, in many ways, has been the situation for the last 10–15 years. While illuminative and inspiring presentations, lectures and workshops at yearly meetings in science, trade and industrial sectors will never fail to make a significant impact, today there is also a community which is of the persuasion that the only thing that counts to disseminate knowledge are webinars, LinkedIn postings and the like. History will judge which avenue fits the bill best for increasing TOS awareness. It is true, however, that systematic efforts in the electronic and the social media are only at the very beginning. The young(er) generation(s) within the TOS community will lead the way!
Minimum competence level
As part of summing up the first part of the Sampling Columns, it is advantageous to present a brief overview of the minimum interest and comprehension necessary to assess the scientific rationale for Theory of Sampling (TOS). Also, why TOS is the necessary-and-sufficient framework for any sampling task, be this the critical primary sampling or any of the subsequent sub-sampling stages along the pathway towards a representative analytical aliquot. It is emphasised that the following applies to sampling of both stationary as well as moving lots (process sampling) of all sizes, forms and shapes.
All materials and lots in science, technology and industry are heterogeneous (Figure 1)—not knowing about heterogeneity (or not caring to know) is a breach of due diligence for all, for OEMs, for trade companies sell ing sampling equipment as well as for sampling professionals. The point of departure for all sampling procedures is heterogeneity – and how to counteract its effect on sampling accuracy and precision.
The primary requirement for all sampling processes, and the corresponding equipment, is that of counteracting the heterogeneity met with. This is the main driving force behind all attempts to sample representatively.
As a minimum it is necessary to be able to distinguish between Incorrect Sampling Errors (ISE), which lead to inaccurate sampling process which produces the fatal sampling bias and Correct Sampling Errors (CSE) which contribute to an unnecessary inflated sampling uncertainty (sampling imprecision). It is critically necessary to be able to distinguish between analytical accuracy and precision, and the sampling bias and precision. There is a world of difference, literally: while an analytical bias can be identified, quantified and thereby corrected for based on the assumption that it is constant (a fair assumption regarding analytical methods), the sampling bias cannot ever be corrected because it is inconstant. 5
All ISE must be eliminated before one can get past the crippling sampling bias, after which CSE must be minimised in order to make the sampling process sufficiently precise (reproducible). A representative sampling process must be unbiased and with an appropriately reduced sampling imprecision so as to become “fit-for-purpose” representative.
TOS provides two facilities for estimating the effective magnitude of the uncertainty associated with any sampling process i) variographic characterisation.7 and replication experiment6 Both of the these allow identification of sampling processes as fit-for-purpose representative, or which are not in compliance with TOS (non-representative). n the latter case, TOS needs to be marshalled competently in order to remedy the sampling stations, procedures, equipment(s) identified as inferior.
These fundamental elements of TOS can be comprehended easily enough (perhaps with a little help from today’s many introductory texts, at all levels imaginable, or from dedicated workshops and courses). A first level competence can in fact be established in a remarkably short time span, for the dedicated audience in as short as, say, two or three days. There are no legitimate reasons to shy away from this modicum of effort in view of the goal: full comprehension of the critical understanding needed to never apply a sampling process without knowing the effective level of uncertainty that can be achieved. While disregard for such a commitment would be serious enough for an individual with sampling responsibilities, picture for example an OEM selling sampling equipment and pitching sampling solutions without having demonstrated to the customer the true quality of the products and services offered? For true quality: read proven representativity.
Figure 1. Heterogeneous material.
Vade mecum
Since 2013, there has been a general standard, in effect an international standard, with the sole purpose of outlining the general principles (there are only six) and the relevant sampling unit operations (there are only four) with which to be able to address any-and-all sampling tasks—for all types of lots (stationary and moving lots), for all levels of heterogeneity (low–intermediate–high), at all scales and under all sampling conditions. TOS to the fore! 8–10
Various treatises also exist dedicated to more focused sectors, e.g. the food and feed sector. “Representative sampling for food and feed materials: a critical need for food/feed safety” is a mini-textbook, ostensibly directed towards this sector, which in reality presents the universal principles and procedures in TOS (Figure 2). 11
Figure 2. The team behind the comprehensive introduction: “Representative sampling for food and feed materials: a critical need for food/feed safety”. Left-to-right: Nancy Theix, Kim H. Esbensen, Charles Ramsey, Claudia Paoletti and Claas Wagner. Photo: the author.
It takes only a few minutes to peruse a random selection of ISO and other guiding documents before one will meet a table in which the number of increments/samples are mandated to be proportional to the size (weight/volume) of the lot (batch, consignment) to be sampled. Here is just one simple test of the validity of such erroneous mandates.
As an example of what is often considered a surprising insight for the uninitiated: It does not matter how large, or small, a particular lot is—the number of samples, or the number of increments to be aggregated into a composite sample in order to counteract a particular heterogeneity met with, does not scale with lot size, but scales with the level of material/lot heterogeneity met with.
According to this mandate, consider two lots of the same size (for this argument assume large lots) but of radically different heterogeneity. One lot is of very low heterogeneity, in fact so low so as to correspond to what in many sectors is called “uniform materials” which are defined as displaying a sampling uncertainty for repeated sampling below 2 %; take a storage silo of refined sugar as an example. The other lot could, e.g., be a run-of-the-mine ore (e.g. a mineralised rock with a very large difference in the proportions of mineralisation). Clearly it is not logical to deploy the same number of increments/samples to counteract the empirical heterogeneity met with for these two dramatically different lots. Even if one is addressing only one-and-the-same lot (i.e. the same heterogeneity), why should small(er) lots merit a smaller number of increments/samples than considerably larger lots if the heterogeneity is the same throughout the lot volume? Such recommendations have not been considered in the light of TOS’ full understanding of the relationships between lot/material heterogeneity and sample mass. This is a breach of due diligence, writ large!
For a compact introduction to these key issues, see References 8 and 12.
In practice…
As an example, who can condone selling “sampling equipment” and “sampling solutions” without having completed a replication experiment or a variographic characterisation of the unit as installed at the customer, with which to demonstrate the necessary “fit-for-purpose” representativity, with respect to a threshold decided upon together with the customer before installation? As a major example, the market and the literature is chock full of industrial hammer samplers and sampling spears (sampling thieves) that have not be subjected to such simple checks.
Why is this so?
This issue gets all the more interesting because there are actually a number of perfectly legitimate examples of installations of these types of sampling equipment that actually do work to a sufficient level of fit -for-purpose representativity (understandably this only is the case for some specific lots and materials of low heterogeneity).
In several practical cases, this has been demonstrated beyond any doubt because the seller was competent and conscientious enough to be in command of the simple six TOS Governing Principles (GP). Even if the buyer should not know this, it is still the obligation of the fair business partner in question to insist on performing this quality check of the equipment to be sold to the customer. This is an absolutely necessary, fair business ethics demand! This argumentation was recently laid out in full in a “tale” that has its roots in the most concrete real world of today. 5,13
The moral from this tale delineates the current frontline regarding how to, and how much to educate about TOS. This concerns the central question: “should one inform the customer in case he/she does not know?”. There are also cases on record in which the customer manifestly does not want to know! Which is another mystery all on its own.
Most importantly: “Is your company, corporation, organisation, institution aware of this fundamental moral obligation?”.
Is your company, corporation, organisation, institution ready to make the ultimate commitment to TOS?
To commit, or not to commit—that is the question!
What could be argument(s) against…
What could be arguments against being, or becoming TOS competent (enough) to live up to the above business ethical obligation? The present writer cannot conjure up any argument against TOS – and never mind the likely polemic accusation of being possessed by a gigantic bias!
This quip aside, this author has never theless had occasion to be exposed to a very large number of precisely such arguments during a 20-year long career within the realm of TOS. These arguments have been presented both from academic and technological communities, but especially from many sectors from industry and commerce. 14
Consider two passionate antidotes for such unwilling, ill-informed, negative attitudes towards a commitment to invoke TOS whenever significantly heterogeneity is encountered. 15,16
By the way, how can one ascertain whether one is addressing a lot material with a significant heterogeneity, or not (hope springs eternal…)? Easy, perform a replication experiment or a variographic characterisation.
PRACTICE, PRACTICE, PRACTICE…
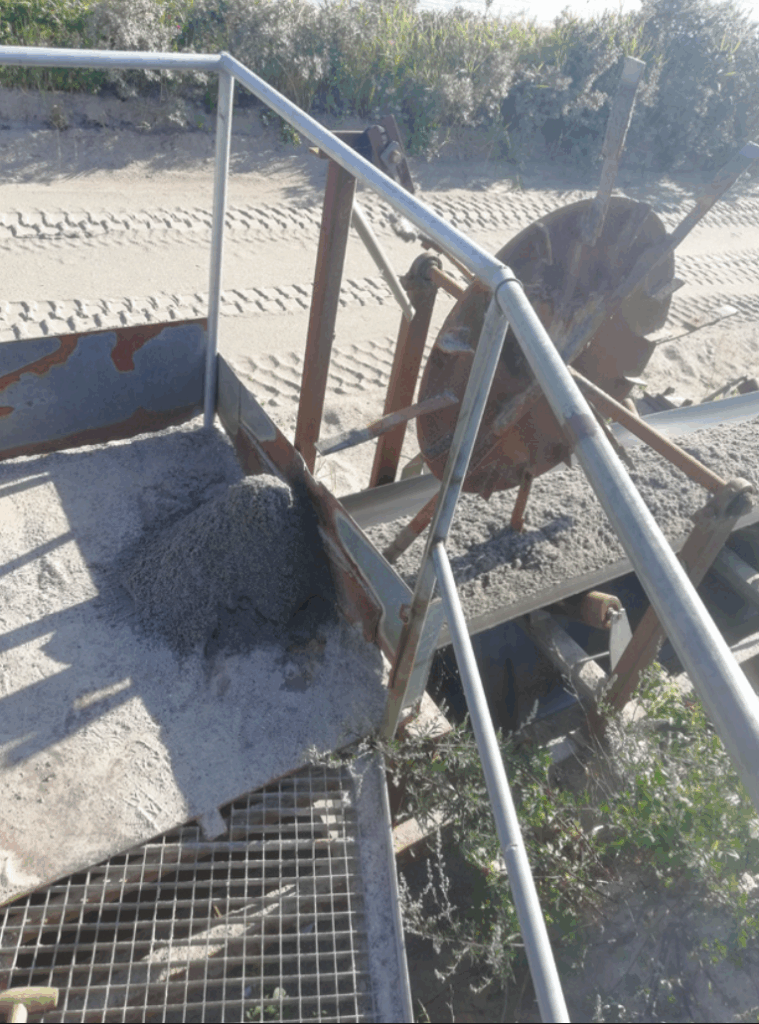
Anticipating the themes that will be presented in the sequel series of Sampling Columns, dedicated to practical examples, case histories, demonstrations of both good (very good, excellent to brilliant) sampling, as well as bad (ill-informed, confused, inferior to critically dangerous) “sampling”, the latter without any right to appear under such a label, examples will mainly be drawn from two sources: “Sampling—Hall of Fame” and its antithesis “Sampling—Hall of Shame”. Two more-or-less self-explanatory examples follow, one extremely simple, the other representing a much evolved and complex sampling situation.
The first is titled: “What’s wrong with this sampler?” Even a cursory inspection will reveal several elements in blatant non-compliance with TOS’ requirements for representative sampling (Figure 3). 17
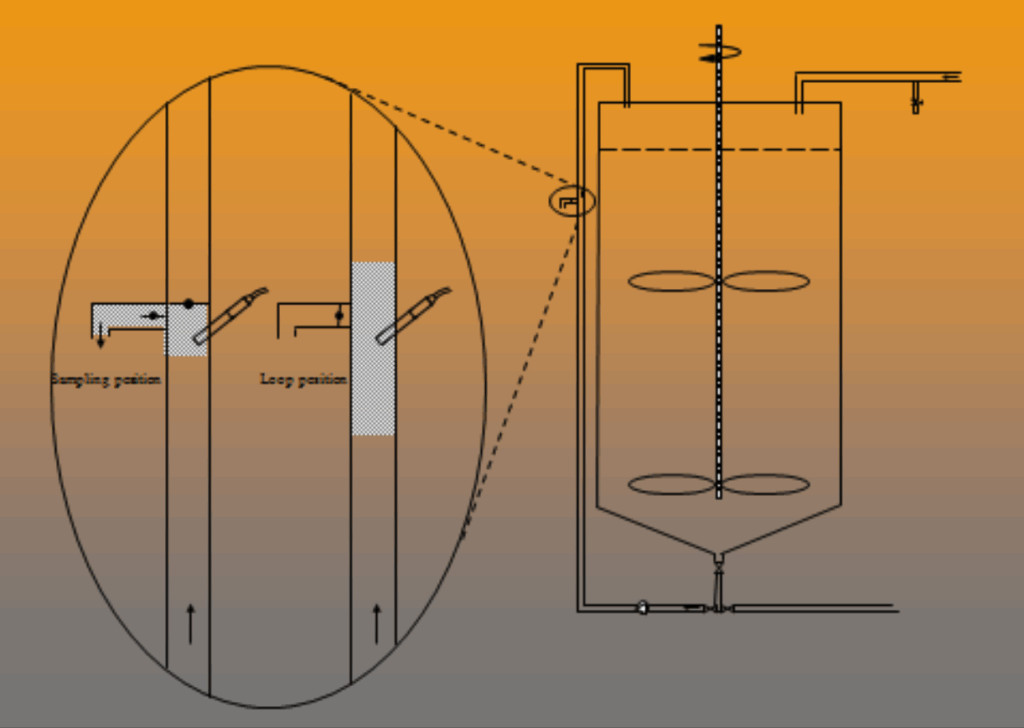
Figure 4 shows the principal design of a process sampling valve and PAT-sensor deployment for a complicated case in which TOS sampling from a reactor is manifestly impossible. The illustration shows a NIR PAT sensor in an optimal location for nearly complete sampling bias elimination and optimised sampling precision made possible by way of a “recurrent loop”. 18
Figure 3. Wheel of fortune? Photo: the author.
The last word
This series of columns has made the strongest possible efforts to present the Theory and Practise of Sampling (TOS) as a logical set of heterogeneity-related principles and practical unit operations in an axiomatic manner. It is complete within its own restricted initiating frame work, but it is, of course, far from complete w.r.t. a fully comprehensive theoretical foundation to which referral must be made to a series of textbooks and seminal papers, all of which constitute a logical next level for the interested reader. It is the hope that the present exposé will have served to initiate and have fostered enough interest for the reader to also want to progress towards this next goal.
It is fair to end this series with a selected key further reading list of suggestions for the next level publications (with a plethora of further references).
Figure 4. PAT sensor in optimal location for nearly complete sampling bias elimination and optimised sampling precision. Copyright KHE Consulting (didactic archives) reproduced with permission.
Further reading (a first foray selection)
P. Gy, Sampling for Analytical Purposes. Wiley, Chichester (1998).
F.F. Pitard, Theory of Sampling and Sampling Practice, 3rd Edn. CRC Press, Boca Raton, Florida (2019).
F.F. Pitard, Pierre Gy’s Theory of Sampling and C.O. Ingamells’ Poisson Process Approach, Pathways to Representative Sampling and Appropriate Industrial Standards. Doctoral thesis in technologies, Aalborg University, campus Esbjerg, Niels Bohrs Vej 8, DK-67 Esbjerg, Denmark (2009).
D. François-Bongarçon and P. Gy, “The most common error in applying ‘Gy’s Formula’ in the theory of mineral sampling and the history of the Liberation factor”, in Mineral Resource and Ore Reserve Estimation – The AusIMM Guide to Good Practice. The Australasian Institute of Mining and Metallurgy, Melbourne, pp. 67–72 (2001).
R.J. Holmes, ”Correct sampling and measurement— the foundation of accurate metallurgical accounting”,
Chemometr. Intell. Lab. Sys. 74, 71–83 (2004). https://doi.org/10.1016/j.chemolab.2004.03.019 G. Lyman, “A brief history of sampling”, AusIMM Bulletin 39–45 (2014).
P. Minkkinen and K.H. Esbensen, “Sampling of par ticulate materials with significant spatial heterogeneity – Theoretical modification of grouping and segregation factors involved with correct sampling errors: Fundamental Sampling Error and Grouping and Segregation Error”, Anal. Chim. Acta 1049, 47–64 (2019) . ht tps://doi.org/10.1016/j.aca.2018.10.0563.
K.H. Esbensen, “50 years of Pierre Gy’s ‘Theory of Sampling’ – WCSB1: a tribute”, Chemometr. Intell. Lab. Syst. 74, 3–6 (2004). https://doi.org/10.1016/j.chemo-lab.2004.06.0054.
P. Gy, “Par t IV: 50 years of sampling theory – a personal history”, Chemometr. Intell.Lab. Syst. 74, 49–60 (2004) https://doi.org/10.1016/j.chemo-lab.2004.05.01411.
K.H. Esbensen, C. Paoletti and N.Thiex, “Representative sampling for food and feed materials: a critical need for food/feed safety”, J. AOAC Int. 98(2), 249–251 (2015). https://doi.org/10.5740/jaoacint.SGE_Esbensen_intro12.
K.H. Esbensen and L.P. Julius, “DS3077 Horizontal—a new standard for representative sampling. Design, history and acknowledgements”, TOS Forum Issue 1, 19 (2013). https://doi.org/10.1255/tosf.713.
K.H. Esbensen, “A tale of two laboratories II: resolution”, Spectrosc.Europe 30(6) , 26–28 (2018).https://www.spectroscopyeurope.com/sampling/tale-two-laboratories-ii-resolution
R.C.A. Minnitt and F.F. Pitard, “Application of variography to the control of species in material process streams: an iron ore product”, J. SAIMM 108(2), 109–122 (2008).
R.C.A. Minnitt and K.H. Esbensen, “Pierre Gy’s development of the Theory of Sampling: a retrospective summary with a didactic tutorial on quantitative sampling of one-dimensional lots”, TOS Forum Issue 7, 7–19 (2017). https://doi.org/10.1255/tosf.96
C. Ramsey, “The effect of sampling error on acceptance sampling for food safety”, WCSB9, Beijing, May 2019.
References
[] K. H. Esbensen, History and Achievements of the World Conference of Sampling and Blending in the Decade 2003–2013. WCSB 6 (2013). https://www.dropbox.com/s/bq5chsjl12o4cm4/History_of_WCSB_KHE_WCSB6_proceedings.pdf?dl=0
[] R.C.A . Minnit t, “The Pierre Gy Oration”, TOS Forum Issue 8, 17 (2018). https://doi.org/10.1255/tosf.104
[] K.H. Esbensen, “50 years of Pierre Gy’s ‘Theory of Sampling’ – WCSB1: a tribute”, Chemometr. Intell. Lab. Syst. 74, 3–6 (2004). https://doi.org/10.1016/j.chemolab.2004.06.005
[] P. Gy, “Par t IV: 50 years of sampling theory — a personal history”, Chemometr. Intell. Lab. Syst. 74, 49–60 (2004). https://doi.org/10.1016/j.chemo-lab.2004.05.014
[] K.H. Esbensen, “A tale of two laboratories I: the challenge”, Spectrosc. Europe 30(5) , 23–28 (2018). https://www.spectroscopyeurope.com/sampling/tale-two-laboratories-i-challenge
[] K.H. Esbensen and Claas Wagner, “Sampling quality assessment: the replication experiment”, Spectrosc. Europe 28(1) , 20–25 (2016) . https://www.spectroscopyeurope.com/sampling/sampling-quality-assessment-replication-experiment
[] K.H. Esbensen and Claas Wagner, “The variographic experiment”, Spectrosc. Europe 29(4), 14–18 (2017). https://www.spectroscop-yeurope.com/sampling/variographic-experiment
[] K.H. Esbensen and Claas Wagner, “ Why we need the Theory of Sampling ”, Analy tical Scientist(2014). https://theanalyticalscientist.com/techniques-tools/why-we-need-the-theory-of-sampling
[] K.H. Esbensen and C. Wagner, “Theory of sampling (TOS) versus measurement uncertainty MU) – A call for integration”, Trends Anal. Chem. 57, 93–106 (2014). https://doi.org/10.1016/j.trac.2014.02.007
[] K.H. Esbensen, C. Paoletti and N. Thiex, “Representative sampling for food and feed materials: a critical need for food/feed safety”, J. AOAC Int. 98(2), 249–251 (2015). https://doi.org/10.5740/jaoacint.SGE_Esbensen_intro
[] K.H. Esbensen and L.P. Julius, “DS 3077 Horizontal—a new standard for representative sampling. Design, history and acknowledgements”, TOS Forum Issue 1, 19 (2013). https://doi.org/10.1255/tosf.7
[] K.H. Esbensen, “A tale of two laboratories II: resolution”, Spectrosc. Europe 30(6) , 26–28 (2018). https://www.spectroscopyeurope.com/sampling/tale-two-laboratories-ii-resolution
[] K.H. Esbensen and C. Paoletti, “Theory of Sampling (TOS): pro et contra”, Spectrosc. Europe 30(1), 23–26 (2018). https://www.spectroscopyeurope.com/sampling/theory-sampling-tos-pro-et-contra
[] K.H. Esbensen, “Pierre Gy (1924–2015): the key concept of sampling errors”, Spectrosc. Europe 30(4), 25–28 (2018). https://www.spectroscopyeurope.com/sampling/pierre-gy-1924%E2%80%932015-key-concept-sampling-errors
[] K.H. Esbensen, “WHAT is wrong with this sampler?”, TOS Forum Issue 8, 16 (2018). doi: https://doi.org/10.1255/tosf.103
[] K.H. Esbensen and P. Mortensen, “Process sampling (Theory of Sampling, TOS) – the missing link in Process Analytical Technology (PAT)”, in Process Analytical Technology, 2nd Edn, Ed by K.A. Bakeev. Wiley, pp. 37–80 (2010). https://doi. org/10.1002/9780470689592.ch3
An aliquot is the ultimate sub-sample extracted in a 'Lot-to-Aliquot' pathway for analysis. By analogy, process analytical technology involves the extraction of virtual samples, which are defined volumes of matter interacting with a process analytical instrument.
Analysis
Analysis is the systematic examination and evaluation of the ultimate sub-sample of chemical, biological, or physical substance (Aliquot) to determine its composition, structure, properties, or presence of specific components.
Analytical Bias
Analytical bias is a systematic deviation of measured values from true values. An analytical bias can arise from multiple sources, including instrument calibration errors, sample preparation techniques, operator method, or inherent methodological limitations. Unlike random errors, which fluctuate unpredictably, analytical bias consistently skews results in a particular direction. Identifying and correcting this bias is crucial to ensure the accuracy and reliability of analytical data (bias correction).
Analytical Precision
Analytical precision refers to the degree of agreement among repeated analyses of the same aliquot under identical conditions. It reflects the consistency and reproducibility of the results obtained by a given analytical method. High precision indicates minimal random analytical error and close clustering of analytical results around an average. Precision does not necessarily imply accuracy, as a method can be precise yet still yield systematically biased results.
C
Composite Sampling
Composite sampling extracts a number (Q) of Increments, established to capture the Lot Heterogeneity. Composite sampling is the only way to represent heterogeneous material. A composite sample is made by aggregating the Q increments subject to the Fundamental Sampling Principle (FSP). The required amount of increments for the requested RepresentativityQ can be carefully established to make sampling fit-for-purpose.
Compositional Heterogeneity (CH)
Compositional heterogeneity is the variation between individual fundamental units of a target material (particles, fragments, cells, ...). CH is an intrinsic characteristic of the target material to be sampled.
Correct Sampling Errors (CSE)
CSE are the errors that cannot be eliminated even when sampling correctly (unbiased) according to the Theory of Sampling (TOS). CSE are caused by Lot Heterogeneity and can only be minimised.
Crushing is the term used for the process of reducing particle size. Other terms are grinding, milling, maceration, comminution. Particle size reduction changes the Compositional Heterogeneity (CH) of a material. Composite Sampling and crushing are the only agents with which to reduce the Fundamental Sampling Error (FSE).
D
Data Format
Data must be reported as the measurement results and the Measurement Uncertainties stemming from sampling and analysis. Note that MUAnalysis and MUSampling are expressed as variances.
Data = Measurement +/- (MUSampling ; MUAnalysis)
Example: 375 ppm +/- (85 ppm ; 18 ppm)
Note that the Uncertainties 85 ppm and 18 ppm are the square roots of MUSampling and MUAnalysis.
Distributional heterogeneity is the variation between groups of fundamental units of a target material. Groups of units manifest themselves as Increments used in sampling. DH is an expression of the spatial heterogeneity of a material to be sampled (Lot).
DS3077:2024
This standard is a matrix-independent standard for representative sampling, published by the Danish Standards Foundation. This standard sets out a minimum competence basis for reliable planning, performance and assessment of existing or new sampling procedures with respect to representativity. This standard invalidates grab sampling and other incorrect sampling operations, by requiring conformance with a universal set of six Governing Principles and five Sampling Unit Operations. This standard is based on the Theory of Sampling (TOS).
A dynamic lot is a moving material stream where sampling is carried out at a fixed location. For both Stationary Lots and Dynamic Lots, sampling procedures must be able to represent the entire lot volume guided by the Fundamental Sampling Principle.
F
Fractionation
Fractionation is a way of processing a Lot or Sample before sampling (or subsampling). Fractionation separates materials/lots into fractions according to particle properties, e.g. size, density, shape, magnetic susceptibility, wettability, conductivity, intrinsic, or introduced moisture ...
Fundamental Sampling Error (FSE)
FSE results from the impossibility to fully compensate for inherent Compositional Heterogeneity (CH) when sampling. FSE is always present in all sampling operations but can be reduced by adherence to TOS' principles. Even a fully representative, non-biased sampling process will be unable to materialise two samples with identical composition due to Lot Heterogeneity. FSE can only be reduced by Crushing (followed by Mixing / Blending) i.e. by transforming into a different material system with smaller particle sizes.
Fundamental Sampling Principle (FSP)
The Fundamental Sampling Principle (FSP) stipulates that all potential LotIncrements must have the same probability of being extracted to be aggregated as a Composite Sample. Sampling processes in which certain areas, volumes, parts of a Lot are not physically accessible cannot ensure Representativity.
Process of extracting a singular portion of the Lot. Grab sampling cannot ensure Representativity for heterogeneous materials. Grab sampling results in a sample designated a Specimen.
Grouping and Segregation Error (GSE)
The GSE originates from the inherent tendency of Lot particles, or fragments hereof, to segregate and/or to group together locally to varying degrees within the full lot volume. This spatial irregularity is called the Distributional Heterogeneity (DH). There will always be segregation and grouping of Lot particles at different scales. GSE plays a significant role in addition to the Fundamental Sampling Error FSE. Unlike FSE however, the effects from GSE can be reduced in a given system state by Composite Sampling and/or Mixing / Blending. GSE can in practice be reduced significantly but is seldomly fully eliminated.
H
Heterogeneity
Heterogeneity refers to the state of being varied in composition. It is often contrasted with homogeneity, which implies complete similarity among components, which is a rare case. For materials in science, technology and industry heterogeneity is the norm. Heterogeneity applies to various contexts, such as populations of non-identical units, bulk materials, powders, slurries, biological swhere multiple distinct components coexist.
Heterogeneitytests are used for optimizing sampling protocols for a variable of interest (analyte, feature) with regards to minimising the Fundamental Sampling Error (FSE).
Experimental approaches available are the 50-particle method, the heterogeneity test (HT), the sampling tree experiment (STE) or the duplicate series/sample analysis (DSA), and the segregation free analysis (SFA).
Recently, sensor-based heterogeneity tests have been introduced which bring the advantage of cost-effective analysis of large numbers of single particles.
Homogeneity
An assemblage of material units with identical unit size, composition and characteristics. There are practically no homogenous materials in the realm of technology, industry and commerce (mineral resources, biology, pharmaceuticals, food, feed, environment, manufacturing and more) of interest for sampling. With respect to sampling, it is advantageous to consider that all materials are in practice heterogeneous.
I
Incorrect Delimitation Error (IDE)
The principle for extracting correctIncrements from processes is to delineate a full planar-parallel slice across the full width and depth of a stream of matter (Dynamic Lot. IDE results from delineating any other volume shape. When a sampling system or procedure is not correct relative to the appropriate Increment delineation, a Sampling Bias will result. The resulting error is defined as the Increment Delimitation Error (IDE). Similar IDE definitions apply to delineation and extraction of increments from Stationary Lots.
Incorrect Extraction Error (IEE)
Increments must not only be correctly delimitated but must also be extracted in full. The error incurred by not extracting all particles and fragments within the delimitated increment is the Increment Extraction Error (IEE). IDE and IEE are very often committed simultaneously because of inferior design, manufacturing, implementation or maintenance of sampling equipment and systems.
Incorrect Preparation Error (IPE)
Adverse sampling bias effects may occur for example during sample transport and storage (e.g. mix-up, damage, spillage), preparation (contamination and/or losses), intentional (fraud, sabotage) or unintentional human error (careless actions; deliberate or ill-informed non-adherence to protocols). All such non-compliances with the criteria for representative sampling and good laboratory practices (GLP) are grouped under the umbrella term IPE. The IPE is part of the bias-generating errors ISE that must always be avoided.
Incorrect Sampling Errors (ISE)
There are four ISE, which result from an inferior sampling process. These ISE can and must be eliminated.
IWE reflects specific weighing errors associated with collecting Increments. For process sampling, IWE is incurred when extracted increments are not proportional to the contemporary flow rate (dynamic 1-dimensional lots), at the time or place of extraction. IWE is often a relatively easily dealt with appropriate engineering attention. Increments, and Samples, should preferentially represent a consistent mass (or volume).
Increment
Fundamental unit of sampling, defined by a specific mass or correctly delineated volume extracted by a specified sampling tool.
L
Legal Person
A legal person is any person or entity that can do the things a human person is usually able to do in law – such as entering into contracts or commit to specified obligations.
Lot
a) A Lot is made up of a specific target material to be subjected to a specified sampling procedure.
b) A Lot is the totality of the volume for which inferences are going to be made based on the final analytical results (for decision-making). Lot size can range from being extremely large (e.g. an ore body, a ship) to very small (e.g. a blood sample).
c) The term Lot refers both to the material as well as to lot size (volume/mass) and physical characteristics. Lots are distinguished as stationary or dynamic lots. A stationary lot is a non-moving volume of material, a dynamic lot is a material stream (Lot Dimensionality). For both stationary and dynamic lots, sampling procedures must address the entire lot volume guided by the Fundamental Sampling Principle (FSP).
Lot Definition
Lot Definition describes the process of defining the target volume, which will be subjected to Sampling.
Lot Dimensionality
TOS distinguishes Lot volume according to the dimensions that must be covered by correct Increment extraction. This defines the concept of 'lot dimensionality', an attribute which is independent of the lot scale. Lot dimensionality is a characterisation to help understand and optimise sample extraction from any lot at any sampling stage. There are four main lot types: 0-, 1-, 2- and 3-dimensional lots (0-D, 1-D, 2-D and 3-D lots).
Lots are classified by subtracting the dimensions of the lot that are fully 'covered' be the salient sampling extraction tool in question. The higher the number of dimensions fully covered in the resulting sampling operation, the easier it is to reduce the Total Sampling Error TSE.
Lot Dimensionality Transformation (LDT)
By the Governing Principle Lot Dimensionality Transformation LDT, stationary 0-D, 2-D and 3-D lots can in many cases advantageously be transformed into dynamic 1-D lots, enabling optimal sampling. However, the application of LDT has practical limits as some lots cannot be transformed (e.g. a body of soil, or a mine resource, biological cells). The optimal approach for such cases is penetrating one dimension with complete increment extraction (usually height) turning a 3-D lot into a 2-D lot.
Mass-reduction is a physical process that divides a given quantity into manageable sub-samples. Mass-reduction must ensure that these sub-samples are representative of the original quantity (Representative Mass Reduction – Subsampling
Measurement
The total process of producing numerical data about a Lot, including sampling and analysis is called Measurement. Simultaneously, sensor-based analytical technology combines virtual sampling and signal processing. For both types of measurements the principles and rules of the Theory of Sampling apply.
Measurement Uncertainty (metrological term) (MU)
MU expresses the variability interval of values attributed to a quantity measured. MU is the effect of a particular error, e.g. a sampling error, or an analytical error or of combined effects (see MUTotal).
MUsampling reflects the variability stemming from sampling errors
MUanalysis reflects the variability stemming from analytical errors
MUtotal is the effective variability stemming from both sampling and analysis
MUtotal= MUsampling+ MUanalysis
Mixing / Blending
Mixing and blending reduces Distributional Heterogeneity (DH) before sampling/sub-sampling. N.B. Forceful mixing is a much less effective process than commonly assumed.
P
Particle-Size-Heterogeneity (PH)
PH is the compositional difference due to assemblages of units with different particle sizes (or particle-size classes).
Pierre Gy
The founder of the Theory of Sampling (TOS), Pierre Gy (1924--2015) single-handedly developed the TOS from 1950 to 1975 and spent the following 25 years applying it in key industrial sectors (mining, minerals, cement and metals processing). In the course of his career he wrote nine books and gave more than 250 international lectures on all subjects of sampling. In addition to developing TOS, he also carried out a significant amount of practical R&D. But he never worked at a university; he was an independent researcher and a consultant for nearly his entire career - a remarkable scientific life and achievement.
Precision
Precision is a measure of the variability of quantitative results. The larger the variability, the smaller the precision. In practice, precision is measured as the statistical variance s2 of the quantitative results (square of the standard deviation).
Primary Sample
The initial mass extracted from the lot. The Primary Sample is the product of Composite Sampling and consists of QIncrements. Both the mass of the Primary Sample as well as the number of increments extracted influence the sampling variability. As the primary sampling stage often has by far the largest impact on MUTotal, optimisation always starts at this stage.
Principle of Sampling Correctness (PSC)
The Principle of Sampling Correctness (PSC) states that all TOS' Incorrect Sampling Errors (ISE) shall be eliminated, or a detrimental Sampling Bias will have been introduced.
Principle of Sampling Simplicity (PSS)
PSS states that sampling along the Lot-to-Aliquot can be optimised separately for each (primary, secondary, tertiary ....) sampling stage. Since the Primary Sampling stage is often the dominant source of sampling error, optimization logically shall always begin at this stage.
Process Periodicity Error (PPE)
PPE is incurred if short-, mid- or long-term periodic process behaviour is not corrected for, in which case it may contribute to a sampling bias.
A process sampling strategy must make use of a high enough sampling frequency to uncover such behaviours; the sampling frequency must as a minimum always be higher than twice the most frequent periodicity encountered.
PTE occurs if mid- to long-term process trends are not corrected for, in which case they may contribute to a Sampling Bias. PTE and Process Periodicity Error PPE may, or may not, occur simultaneously depending on the specific nature of the process to be sampled.
The replication experiment RE consists of a series of independent complete ‘Lot-to-Aliquot’ analytical determinations, made under identical conditions. The number of replications is termed R. RE provides MUSampling + MUAnalysis.
Representative Mass Reduction – Subsampling
Representative Mass Reduction (RMR) aka sub-sampling. TOS argues why Riffle-Splitting and Vezin-sampling are the only options leading to Representative Mass Reduction.
Representativity
A sampling process is representative if it captures all intrinsic material features, e.g., composition, particle size distribution, physical properties (e.g. intrinsic moisture) of a Lot.Representativity is a characteristic of a sampling process in which the Total Sampling Error and Total Analytical Error have been reduced below a predefined threshold level, the acceptable Total Measurement Uncertainty. Representativity is the prime objective of all sampling processes. The representativity status of an individual sample cannot be ascertained in isolation, if removed from the context of its full sampling-and-analysis pathway. The characteristic Representative can only be accorded a sampling process that complies with all demands specified by TOS (DS3077:2024).
S
Sample
Extracted portion of a Lot that can be documented to be a result of a representative sampling procedure (non-representatively extracted portions of a Lot are termed Specimens).
Closeness of the analytical result of an Aliquot with regards to the true concentration of the Lot]/glossary]. NB. “sampling accuracy” = “sampling + analytical accuracy”
Sampling Bias
The Sampling Bias is the difference between the true Lot concentration and the average concentration from replicated sampling. Such a difference is a direct function of the Lot Heterogeneity and as such inconstant; it changes with each additional sampling and can therefore not be corrected for. This is the opposite to the Analytical Bias for which correction is often carried out.
Sampling Error Management (SEM)
SEM determines the priorities and tools for all sampling procedures in the following order:
The Sampling Manager is the Legal Person accountable for ensuring that all sampling activities are conducted in accordance with scientifically valid principles to achieve representative results. They are responsible for managing the design, implementation, and evaluation of sampling protocols while balancing constraints such as material variability, logistics, and resource limitations. This role requires expertise in the Theory of Sampling (TOS), leadership, project management and stakeholder communication skills.
Sampling Precision
The Sampling Precision is the variance of the series of analytical determinations, for example from a Replication Experiment (RE). Sampling precision always includes the Analytical Precision, since all analysis is always based on an analytical Aliquot, which is the result of a complete 'Lot-to-Aliquot' sampling pathway. Therefore sampling precision = sampling + analysis precision.
Sampling Protocol
Document explaining the undertakings necessary for the sampling process. It contains the tools and procedures from Lot-to-Aliquot[/glossary].
Sampling Scale Invariance (SCI)
The Principle of SSI states that all Sampling Unit Operations (SUO) can be applied identically to all sampling stages, only the scale of sampling tools differs.
Sampling Uncertainty
Sampling Uncertainty is the difficulty of collecting a representativesample due to Lot Heterogeneity; the more heterogeneous the material, the higher the uncertainty associated with any sample attempting to represent the whole Lot.
A specimen is a portion of a larger mass/volume (Lot) extracted by a non-representative sampling process. Grab Sampling results in a specimen.
Stakeholder
A Stakeholder is any entity interested in the result coming from sampling and analysis. Data representing stationary or flowing heterogeneous materials are requested by different parties with a multitude of differing objectives. Stakeholders can be internal, from commercial organisations, public authorities, research and academia or non-governmental organisations.
Stationary Lot
A Stationary Lot is a non-moving volume of material where sampling is carried at from multiple locations, each resulting in an Increment. For both Stationary Lots and Dynamic Lots, sampling procedures must address the entire Lot volume guided by the Fundamental Sampling Principle (FSP).
TAE is manifested as the Measurement Uncertainty resulting only from analysis (MUAnalysis). TAE includes all errors occurring during assaying and analysis (e.g. related to matrix effects, analytical instrument uncertainty, maintenance, calibration, other), as well as human error.
Total Measurement Uncertainty
Whereas Measurement Uncertainty (MU) is traditionally only addressing analytical determination, e.g. concentration := 375 ppm +/- 18 ppm (MUanalysis), Theory of Sampling (TOS) stipulates reporting analytical results with uncertainty estimates from both sampling and analysis. This gives users of analytical data the possibility to evaluate the relative magnitudes of MUsampling vs. MUanalysis, enabling fully informed assessment of the true, effective data quality involved. A complete data uncertainty must have this format:
MUTotal = MUSampling + MUAnalysis
The attribute Total Measurement Uncertainty (MUTotal) is the most important factor determining the attribute data quality.
Variography is a variability characterisation of a dynamic 1-dimensional dynamic lot. A variogram describes variability as a function of Increment pair spacing (in time). Variography is also applied in geostatisctics in describing the variability as a function of spacing/distance between analyses.